


Customize the data that you use to analyze your team
Our Teams and Schools memberships allow you to assign custom content and track the progress of your design team or students. Being able to understand performance and progress is an important part of helping your designers and students learn cutting-edge skills. To help you quickly and easily get the information you need, we streamlined reporting features from the Admin Tools and put them in the Reporting section on the Dashboard:

The Reporting section contains data from the Reports and Reporting 2.0 tabs that were previously part of the Admin Tools. In addition to a cleaner interface, we’ve also added the flexibility to filter your data by date range instead of viewing only the last 90 days. There are two parts of the new Reporting section to help you dissect the improvement of your team or students.
New to reporting
Get data about your team or students at a glance in the Overview portion of Reporting. The information found here is identical to what Teams used to find in the Reporting 2.0 tab; this data is now available to Schools too! You’ll find a few different slices of your team’s or students’ progress:
- Total views by all team members or students
- Number of searches
- Number of tests taken
- Number of documents downloaded
- Top 5 Team Members or Students, Top 5 Groups or Classes, and Top 5 Content
Use the “Report range” filters to adjust the time frame of the stats and Top 5 sections below:

Groups
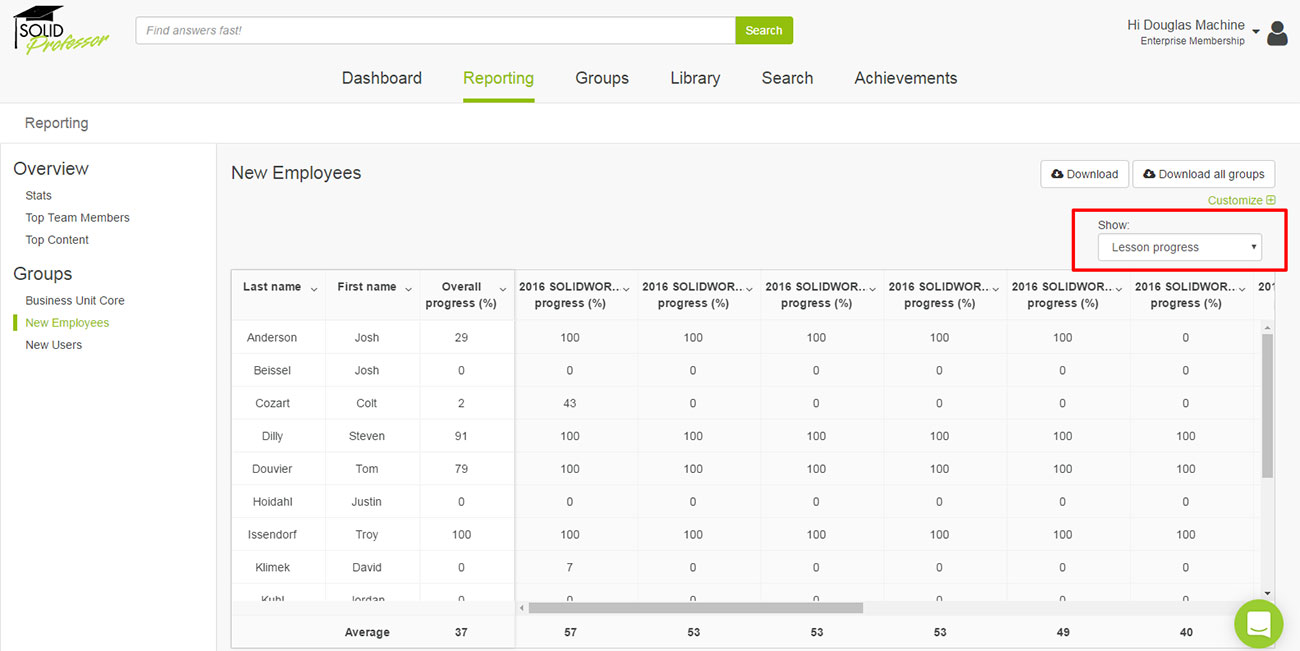
When you want more detail about the progress of your team or students, head to the Groups portion of Reporting, which replaces the Reports tab from the Admin Tools and offers more flexibility for you to find the data you need. By default, members’ lesson progress is shown; however, using the “Show” drop-down menu, you can view the following for each assignment:
- Lesson progress
- Baseline test score (if baseline tests are enabled)
- First review test score
- Latest review test score
- Best review test score
- Average review test score
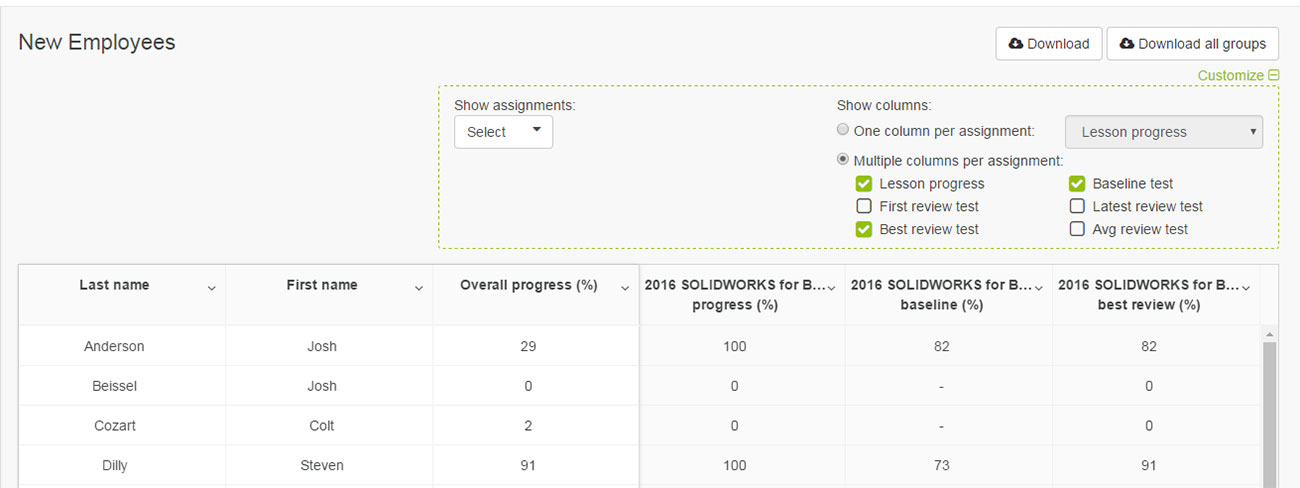
Using the “Customize” link, you can also build custom reports and download them to Excel files:
Finally, as part of these reporting changes, we’ve renamed the “Users” tab to “Team Members” in the Admin Tools. We have also left the Tests tab intact. If you’re interested in viewing a complete bank of every test (baseline and review) taken by members, you can find that information under the Tests tab. You can also use the linked Test ID, to view the exact questions and answers of any designer or student on any test.
As you explore our new reporting features, we’d love to hear what you think!
Share this post


